Azure-in-bullet-points
Azure Monitor
- Allows continuous monitoring.
- Collect & analyze & act on telemetry data from cloud & on-prem environment
- It collects Metrics (e.g. CPU usage) and Logs
- Tools:
- Insights
- Application Insights
- Containers
- Virtual Machines
- Diagnostics (Microsoft docs)
- You can use the Diagnostics extension of the virtual machine to collect data.
- E.g. Performance counters, Windows Events logs in Table Storage, or IIS logs in Blob storage

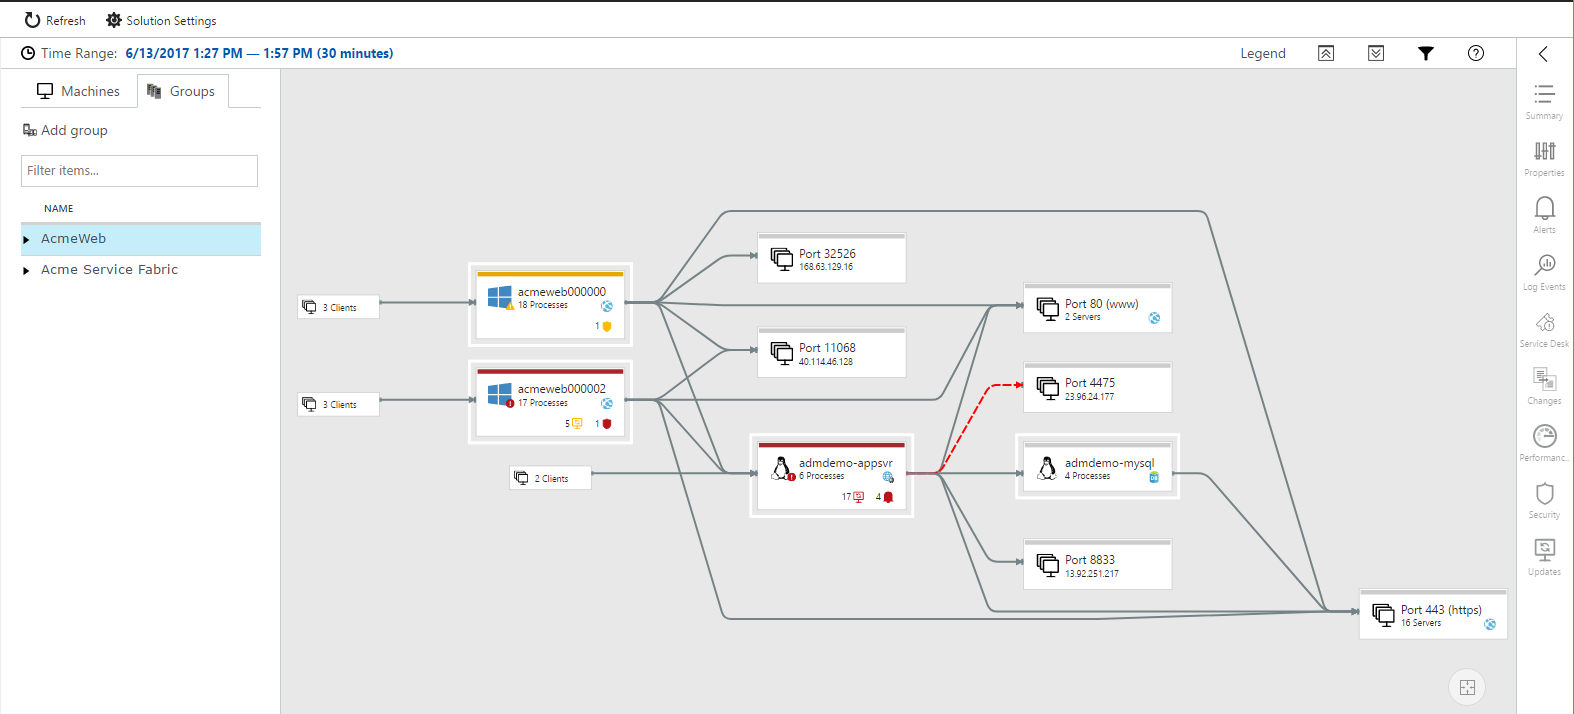
- Service Map automatically discovers application components on Windows and Linux systems and maps the communication between services
- Diagnostics (Microsoft docs)
- Monitoring Solutions (easy to go monitoring setups)
- Visualizations
- Dashboards
- Views (from log queries)
- Power BI
- Workbooks (interactive reports, dashboards on steroids)
- Optimizations
- Analyze
- Metric Analytics to query metrics
- Log Analytics to query logs
- Uses ad-hoc query language Kusto
- Respond
- Alerts
- The IT Service Management Connector (ITSMC)
- Provides a bi-directional connection between Azure and ITSM tools to help you resolve issues faster.
- E.g. ServiceNow, System Center Service Manager, Provance, Cherwell
- Allows you to
- Create work items in ITSM tool, based on your Azure alerts
- metric alerts, Activity Log alerts and Log Analytics alert).
- Sync your incident and change request data from your ITSM tool to an Azure Log Analytics workspace.
- Create work items in ITSM tool, based on your Azure alerts
- The IT Service Management Connector (ITSMC)
- Autoscale
- Alerts
- Integrate
- Logic Apps
- Export APIs
- Analyze
- Insights
Application Insights
- Monitor and diagnose availability, usage & performance of web apps
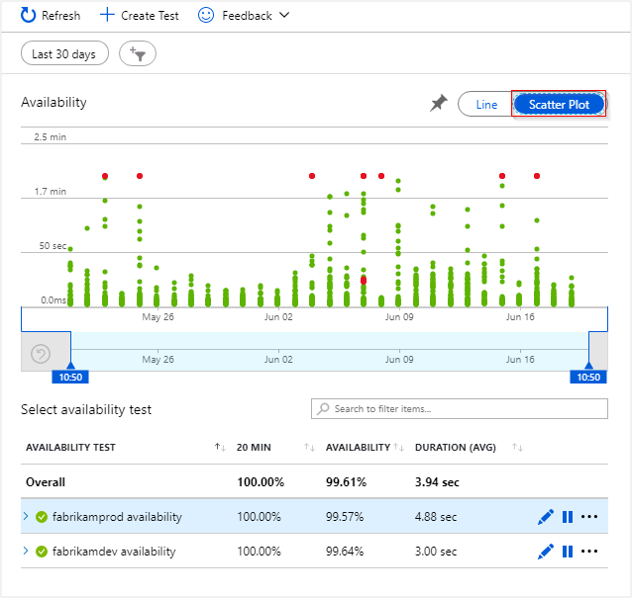
- Availability tests: Alerts if your application isn’t responding, or if it responds too slowly.
- URL tests test URL for status code or ping.
- Multi-step tests: Test recorded sequence of URLs and interactions
- Performance tests: Set user load & duration
- or can run custom Azure Functions

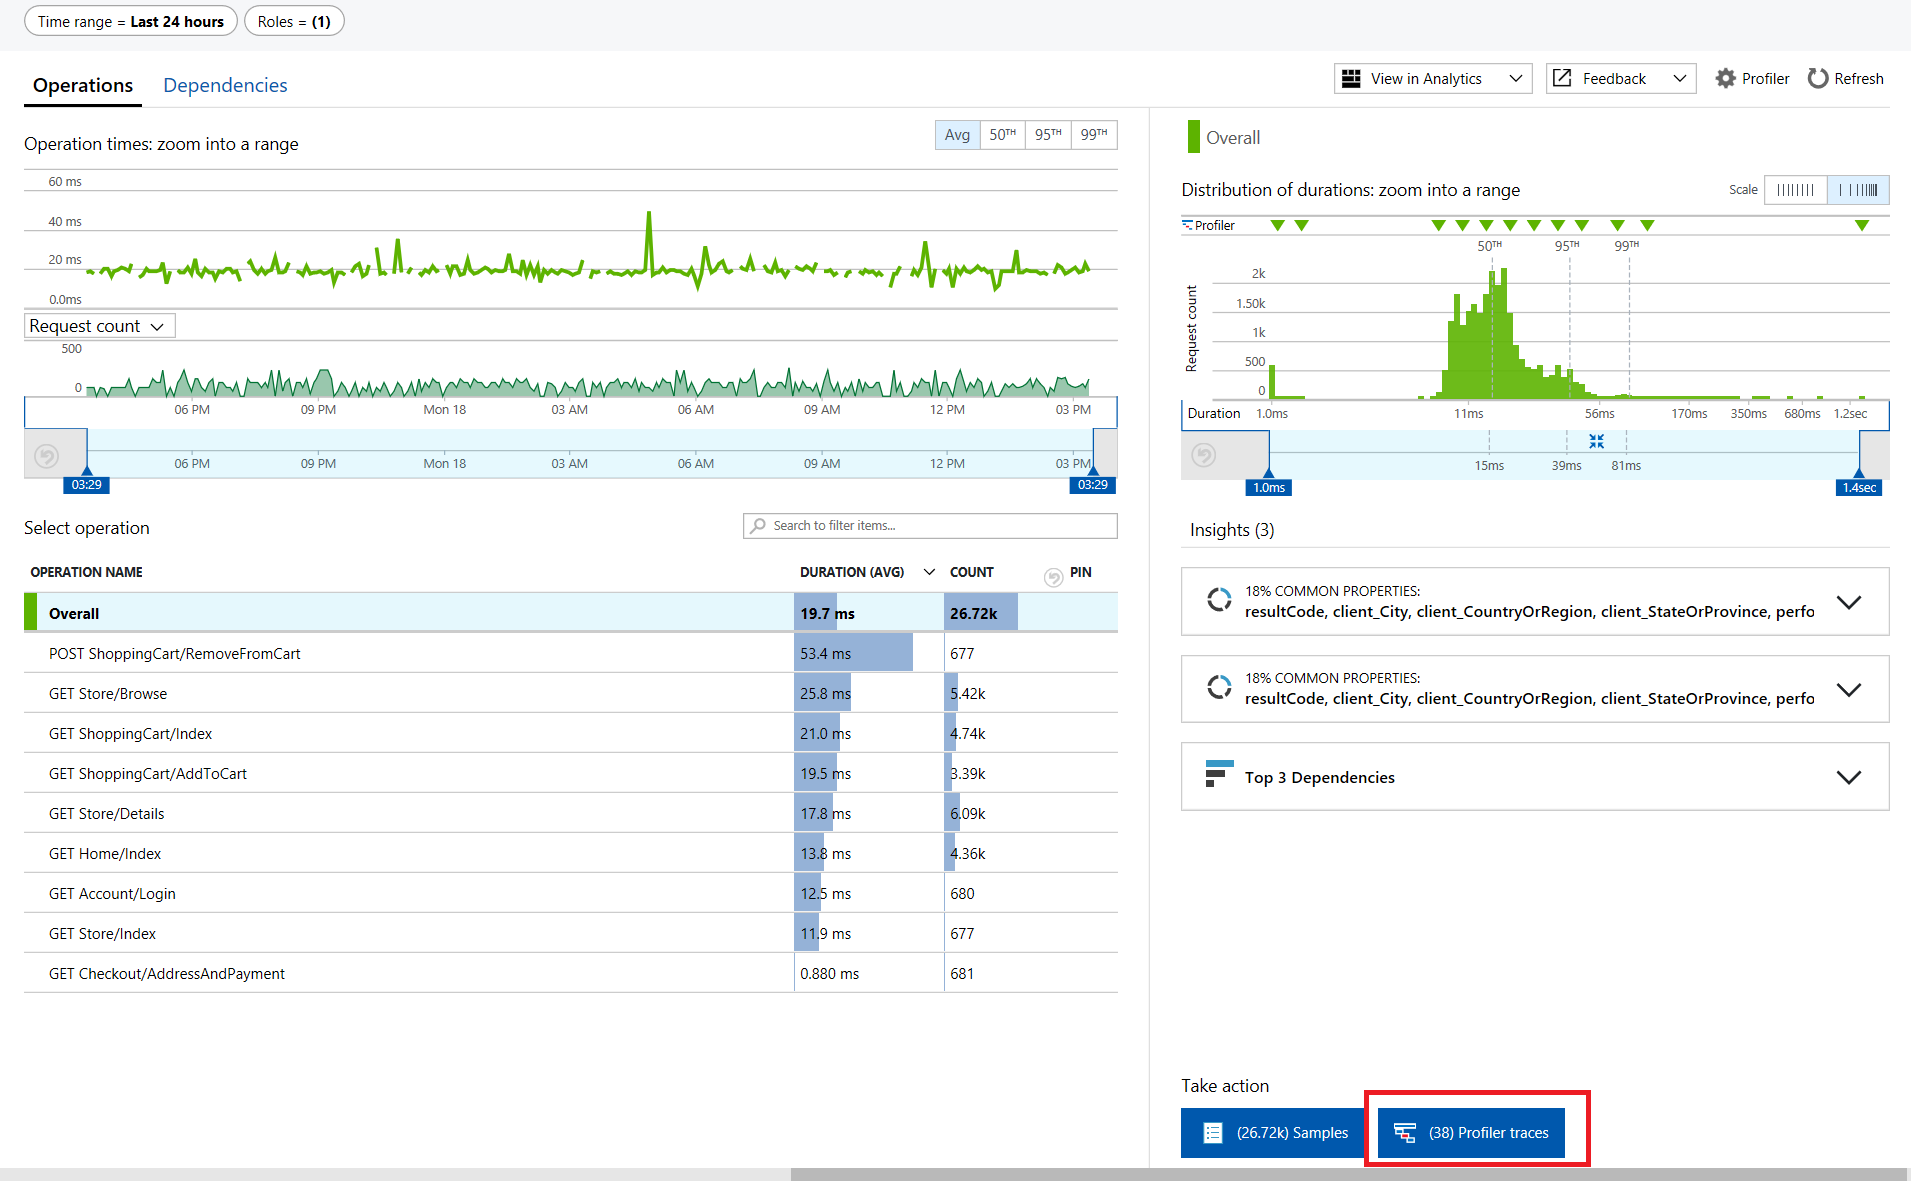
- Profiler captures data & provides performance traces.
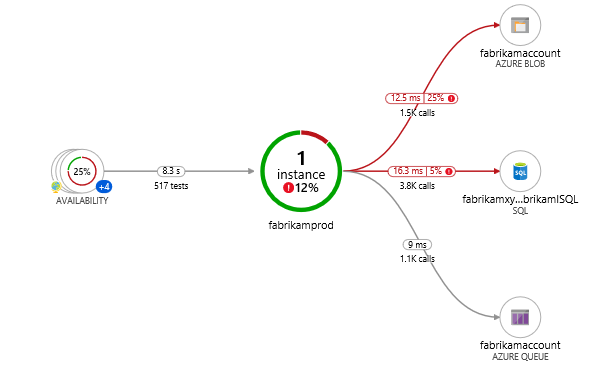
- Application Map
- Helps you spot performance bottlenecks or failure hotspots
- KPIs such as load, performance and failures, availability test failures

- Smart Detection
- Failure Anomalies: ML based
- Performance Anomalies
- General degradations and issues, like Trace degradation, Memory leak, Abnormal rise in Exception volume and Security anti-patterns.
- Usage Analysis
- Track users & user behavior.
- what pages they’re most interested in, where your users are located, what browsers and operating systems they use.
- Users: numbers of unique users that access your pages within your chosen time periods
- Sessions: the number of user sessions that access your site
- Retention
- how many users come back & how often they perform particular tasks or achieve goals
- show user who used any event or page view and returned to use any event or page view over x period.
- Events
- Send custom business events & track feature usages
-
Allows you to do A B Testing & measure the success of each, and then move to a unified version. - Funnels
- The progression through a series of steps in a web application is known as a funnel
- E.g. how many users are viewing the home page, viewing a customer profile, and creating a ticket
- Cohorts
- A cohort is a set of users, sessions, events, or operations that have something in common
- Defined by an analytics query
- Difference from filters: more adaptable, complex, other team members in your team can reuse them.
- You can use template gallery e.g.:
- Engaged Users – by Days Used
- User flow
- Visualizes how users navigate between the pages and features of your site
- Starts from an initial page view, custom event, or exception
- User Flows shows the events that happened before and afterwards during user sessions
- Lines of varying thickness show how many times each path was followed by users
- Impact
- It discovers how any dimension of a page view, custom event, or request affects the usage of a different page view or custom event.
- e.g. how load times influence conversation rates

